
The fastest way to improve forecast accuracy is to pair ICP-aligned pipeline controls, deal-level behavioral signals, and a weekly forecast governance cadence. No single method fixes a broken forecast. Weekly forecasting cadence and pipeline velocity tracking correlate with materially higher accuracy than irregular check-ins. Combining two or three forecasting methods consistently beats relying on any one.
Here's what you can change this week without waiting on a new tool or a budget approval:
- Enforce stage exit criteria so a deal can't sit in "Proposal" without a signed scope document or verbal budget confirmation.
- Start a weekly variance review that compares last week's forecast to this week's actual movement, deal by deal.
- Add three behavioral signals to your pipeline reviews: engagement recency, stakeholder count, and response velocity.
- Strip subjective "gut feel" probabilities from your CRM and replace them with segment-level historical close rates.
- Require every rep to log call outcomes and next steps the same day, not at the end of the week.
Your first quarter of change should follow a simple sequence:
- Week 1: Audit your CRM fields for missing close dates, stale stages, and duplicate deals. Fix the worst offenders.
- Weeks 2 through 4: Roll out stage exit criteria and start logging behavioral signals on every active deal.
- Month end: Run your first formal variance review and calculate a baseline forecast accuracy rate to measure against going forward.
Key Takeaways
Accurate sales forecasting comes from combining clean pipeline data, behavioral signals, and a weekly review cadence rather than betting everything on one method or one rep's gut feel.
| Point | Details |
|---|---|
| Fix data hygiene first | Audit CRM fields for missing close dates and stale stages before adding any advanced model. |
| Track behavioral signals | Log engagement recency, stakeholder count, and response velocity on every active deal. |
| Combine two methods | Blend stage-weighted pipeline with a time-series or behavioral score rather than relying on one. |
| Run weekly governance | Weekly pipeline reviews plus monthly deep dives catch drift before it becomes a quarter-end surprise. |
| Log activity consistently | Tools like Dialed Sales capture call outcomes and follow-ups in seconds, feeding the signals your forecast needs. |
Table of Contents
- Why Accurate Sales Forecasting Matters
- The Core Best Practices High-Performing Revenue Teams Use
- Forecasting Methods and When Each One Works
- What Data and Signals Belong in Your Forecast
- Step-By-Step: Build a Repeatable Forecasting Process This Quarter
- How to Measure Forecast Accuracy and Track the Right KPIs
- Forecast Governance: Meeting Rhythm, Roles, and Decision Rules
- Common Forecasting Mistakes and How to Fix Them Fast
- Which Tools to Use and How to Choose
- Why Combining Forecasts Works, Backed by Research
- A Copyable 30/60/90 Checklist to Start This Quarter
- What Actually Moves the Needle in Real Sales Teams
- How Better Activity Logging Supports Better Forecasts
- Sources
Why Accurate Sales Forecasting Matters
A forecast is not a status report. It's a document that other people use to make real decisions, and when it's wrong, those decisions are wrong too. Only 45% of sales leaders say they're confident in their organization's sales forecasts, according to Fullcast's research, which means more than half of the leaders setting hiring plans, territory maps, and quota targets are doing it on numbers they don't fully trust.
That gap has teeth. A forecast that overshoots can lead a company to premature hiring, territory expansion, or overoptimistic revenue expectations. Undershooting may starve the pipeline of needed resources. Both errors can compound if unaddressed.
Reliable forecasts change what a business can do with confidence:
- Hiring plans get built on realistic revenue timing instead of best-case guesses.
- Territory and quota design reflects actual pipeline coverage instead of last year's assumptions.
- Cash flow planning accounts for when deals close, not just whether they eventually will.
- Board and investor conversations rest on numbers the sales team has actually stress-tested.
None of this requires a sophisticated data science team. It requires discipline about what goes into the forecast and how often someone checks it against reality.
The Core Best Practices High-Performing Revenue Teams Use
Teams that consistently hit their forecast numbers aren't smarter than everyone else. They just run a tighter process, and that process comes down to five repeatable habits.
- Lock down pipeline quality controls. Every deal entering the forecast should match your ideal customer profile, carry a realistic close date, and meet a coverage ratio your team has validated historically (most B2B teams target a multiple of pipeline coverage against quota).
- Track deal-level behavioral signals, not just stage. A deal that's been sitting in "Negotiation" for six weeks with no email replies is not the same as one that just had three stakeholders join a call.
- Combine rep input, model prediction, and manager review. Rep-submitted commits capture context a spreadsheet can't see; a stage-weighted or time-series model catches the optimism bias reps bring to their own pipeline. Use both, and have a manager reconcile the difference before it rolls up.
- Separate "commit" from "forecast." Commit deals are ones a rep will stake their reputation on closing this period. Forecast deals are everything else that's plausible. Blending the two hides risk from leadership.
- Run a governance cadence that never slips. Weekly checks, monthly deep dives, and quarterly post-mortems are how you catch drift before it becomes a quarter-ending surprise.
Pro Tip: Keep a running variance log, one line per week, showing forecasted amount versus actual close. After eight weeks you'll see exactly where your forecast tends to drift, high or low, and by how much. That log is worth more than any single accuracy metric because it shows you the pattern, not just the snapshot.
Pipeline quality controls specifically should include:
- ICP fit scoring on every opportunity before it's counted toward forecast.
- A minimum coverage ratio requirement segmented by rep tenure and territory maturity.
- Documented stage exit criteria that a manager, not just the rep, has to confirm.
Behavioral signals worth tracking on every active deal:
- Days since last meaningful buyer engagement.
- Number of distinct stakeholders who've interacted with your team.
- Response time to your last outreach, compared to the deal's historical average.
Forecasting Methods and When Each One Works
There's no single best forecasting method. The right choice depends on data availability, market stability, and how far out you're forecasting, and most mature teams end up running more than one method at once rather than betting everything on a single approach.
Historical/trend forecasting looks at what closed in prior periods and projects forward. It's simple, fast to set up, and reasonably reliable in stable markets with consistent deal sizes. It falls apart the moment your product mix, pricing, or sales motion changes significantly.
Stage-weighted pipeline forecasting multiplies each deal's value by a probability tied to its current stage. It's the most common starting method because it only requires clean CRM stage data, but its accuracy depends entirely on whether your stage probabilities reflect reality rather than a guess someone made years ago.
Rep-commit forecasting relies on the salesperson's own judgment about which deals will close. It captures context that a formula misses, like a competitor dropping out or a champion changing jobs, but it's vulnerable to optimism bias and inconsistent standards from rep to rep.
Time-series and regression models use statistical patterns in historical data, sometimes incorporating seasonality, to project future revenue. These need a meaningful volume of historical data and a reasonably stable environment to be worth the setup effort.
Predictive AI and machine learning models score deals or predict close probability based on hundreds of variables pulled from CRM and engagement data. They can outperform simpler methods once your data is clean and consistent, but garbage activity logging produces confidently wrong predictions just as easily as it produces good ones.
Prescriptive analytics goes a step further, not just predicting outcomes but recommending specific actions (which deals need attention, which reps need coaching) to change the outcome. It's the most advanced tier and generally only worth pursuing once the earlier methods are already running cleanly.
Most practitioner guidance points toward combining two or three of these rather than picking one. A common recipe for growing B2B teams is a stage-weighted baseline, layered with opportunity scoring from behavioral signals, checked against a historical sanity check that flags when the model's output looks wildly different from last quarter's pattern.
| Method | Best for (team size / maturity) | Required data & inputs | Accuracy tradeoffs | Time horizon | Complexity | Integration & automation | Cost / scalability |
|---|---|---|---|---|---|---|---|
| Historical/trend | Small teams, early-stage data | 2+ quarters of close history | Moderate, weak in volatile markets | Quarterly to annual | Low | Spreadsheet-friendly | Free to low cost |
| Stage-weighted pipeline | Small to mid-size teams | Clean stage data, defined exit criteria | Moderate, depends on stage discipline | Monthly to quarterly | Low to moderate | Native to most CRMs | Low, scales with CRM |
| Rep-commit | Any size, especially early-stage teams | Manager review process | Variable, prone to bias | Weekly to monthly | Low | Manual or CRM fields | Low |
| Time-series/regression | Mid-size to large teams with data volume | 12+ months of clean historical data | High in stable markets | Quarterly to annual | Moderate to high | Requires BI or analytics layer | Moderate |
| Predictive AI/ML | Larger teams with mature CRM hygiene | Consistent activity and outcome logging | High, contingent on data quality | Monthly to quarterly | High | Needs dedicated platform | Higher cost, scales well |
| Prescriptive analytics | Enterprise teams with established ML forecasting | All of the above plus coaching data | Highest, when inputs are trustworthy | Ongoing/real-time | Very high | Deep CRM and BI integration | Highest cost |
What Data and Signals Belong in Your Forecast
Your forecast is only as good as the fields your reps actually fill in. Reliable forecasts depend on objective signals like deal velocity, buyer engagement, and historical close rates by segment, not on how confident a rep sounds in a pipeline review.
The core CRM fields that should be mandatory, not optional, on every opportunity:
- Close date, updated whenever it slips (not silently pushed without a note explaining why).
- Deal amount, broken out by product line if you sell more than one thing.
- Current stage, tied to documented exit criteria the rep can point to.
- Deal owner and lead source, so you can segment accuracy by channel later.
Behavioral signals worth layering on top of the basic fields:
- Engagement recency: how many days since the buyer last responded or attended a meeting.
- Stakeholder breadth: how many distinct people at the account have engaged with your team.
- Response velocity: how quickly the buyer replies compared to their own historical pace.
- Deal velocity: how many days the opportunity has spent in its current stage versus your average.
Data quality problems hide in plain sight. Look for deals with no close date changes in 90 days (a sign nobody's touching the record), default probability values that were never customized, and duplicate or "phantom" opportunities that inflate pipeline coverage without representing real revenue. A quick audit catches most of this in an afternoon, and it's worth revisiting monthly, not just once. Our guide on the role of data in sales decisions walks through this kind of audit in more depth.
| Input | Why it matters | Simple validation rule |
|---|---|---|
| Close date | Drives which period a deal counts toward | Flag any deal unchanged for 60+ days |
| Deal amount | Determines forecast weight and coverage math | Flag amounts of unusually round numbers |
| Stage | Sets probability weighting in stage-weighted models | Require documented exit criteria met before advancing |
| Engagement recency | Signals real momentum versus stalled deals | Flag deals with no logged activity recently |
| Lead source | Enables segment-level accuracy tracking | Require on all new opportunities |
Step-By-Step: Build a Repeatable Forecasting Process This Quarter
Start by defining what the forecast actually needs to answer. A monthly forecast informs staffing and short-term resource shifts. A quarterly forecast drives board reporting and quota tracking. An annual forecast shapes hiring plans and budget commitments. Map out which decisions depend on which horizon before you touch a spreadsheet, because the level of precision you need changes with the stakes.
Next, segment your forecast by whatever dimension actually behaves differently in your business, whether that's product line, region, or deal size band. A $200,000 enterprise deal and a $2,000 self-serve deal shouldn't share the same stage exit criteria or probability curve, and lumping them together muddies the accuracy of both.
Assign clear ownership. Reps own accurate, timely data entry on their own deals. Managers own reconciling rep commits against model output and flagging deals that look inflated or sandbagged. RevOps owns the data infrastructure and reporting cadence. A VP or sales leader owns the final number that goes to the board, and needs an escalation path when a manager's rollup looks off.
Here's a realistic rollout timeline:
- Week 1: Audit CRM data quality, fix critical gaps, and document current stage definitions.
- Week 2: Set or revise stage exit criteria per segment, and get manager sign-off.
- Week 3: Introduce behavioral signal tracking and train reps on why it matters, not just how to log it.
- Week 4: Run your first governance meeting under the new process and capture a baseline accuracy number.
- Month 2: Extend segmentation, refine probability weights based on the first month of variance data.
- Month 3: Formalize the quarterly post-mortem and lock in your accuracy benchmark for the next quarter.
Pro Tip: Don't roll out every change at once. Teams that try to fix data hygiene, add behavioral signals, and change the meeting cadence in the same week usually get rep pushback on all three at once. Sequence it, and let each change earn buy-in before you add the next one.
How to Measure Forecast Accuracy and Track the Right KPIs
Forecast accuracy rate is the simplest metric: take your forecasted amount, subtract the actual closed amount, divide by the forecasted amount, and express it as a percentage. If you forecasted $500,000 and closed $460,000, you're 92% accurate for that period, off by 8%.
Mean Absolute Percentage Error, or MAPE, is more useful when you're tracking accuracy across multiple deals or periods, because it averages the absolute size of your errors rather than letting overshoots and undershoots cancel each other out. Symmetric MAPE (sMAPE) adjusts for the fact that standard MAPE can overweight errors when actuals are small, which matters if you're forecasting at the segment or rep level where individual numbers can be volatile.
Beyond the headline accuracy number, track:
- Forecast stability: how much your number moves week to week within the same period. Wild swings suggest the forecast is being guessed at, not built.
- Time-to-accuracy: how many weeks into a period before your forecast stabilizes within an acceptable range of the eventual actual.
- Accuracy by rep and by segment: aggregate accuracy can hide a rep who consistently sandbags or a segment where the model consistently misses.
Set realistic targets before you chase perfection. A newly formalized process might start in the 70% to 80% accuracy range and climb from there; expecting 95% accuracy in your first quarter of tracking sets everyone up to feel like they're failing a metric that's brand new.
- Calculate a baseline accuracy rate using your last two closed quarters.
- Recalibrate stage probabilities using trailing 90-day conversion rates rather than long-run averages, since recent conversion behavior reflects current market conditions better than a two-year average.
- Back-test weekly, but only adjust probability weights on a monthly cycle to avoid chasing noise.
Forecast Governance: Meeting Rhythm, Roles, and Decision Rules
Treating forecasting as a continuous cadence rather than a static end-of-quarter report is what separates teams that catch problems early from teams that get blindsided. Leaders who review forecasts weekly correct course while there's still time to act, instead of discovering a miss the week before quarter close.
A working governance structure typically looks like this:
- Weekly pipeline reviews: reps and frontline managers, focused on deal-level movement and flagging stalled opportunities.
- Bi-weekly forecast updates: managers roll up numbers to sales leadership, highlighting any material change from the prior update.
- Monthly deep dives: sales leadership and RevOps examine accuracy trends, segment performance, and whether stage probabilities need adjustment.
- Quarterly post-mortems: the full leadership team reviews what the forecast got right, what it missed, and why.
Set clear decision rules for when a forecast number actually changes. A deal that's slipped its close date twice should trigger a probability downgrade automatically, not wait for someone to notice. A rep whose commit has missed by more than 20% for two consecutive periods should trigger a coaching conversation, not just a raised eyebrow in a meeting.
| Cadence | Purpose | Attendees | Output |
|---|---|---|---|
| Weekly pipeline review | Catch stalled or at-risk deals early | Reps, frontline managers | Updated deal-level probabilities |
| Bi-weekly forecast update | Roll up changes to leadership | Managers, sales leadership | Adjusted team forecast |
| Monthly deep dive | Review accuracy and segment trends | Sales leadership, RevOps | Recalibrated stage probabilities |
| Quarterly post-mortem | Learn from misses and hits | Full leadership team | Documented process changes |
Common Forecasting Mistakes and How to Fix Them Fast
The mistakes that wreck forecast accuracy aren't exotic. They're the same handful of habits repeating quarter after quarter across most sales teams.
- Relying on rep gut feel instead of documented, segment-specific close rates.
- Letting stage definitions stay vague enough that two reps interpret "Qualified" completely differently.
- Skipping activity logging, so there's no behavioral signal to check a rep's optimism against.
- Never keeping a variance log, so the same forecasting error repeats every quarter without anyone noticing the pattern.
Here's what that looks like before and after. A team with loose stage definitions might see a rep mark a deal "Committed" based on one good call, then watch it slip for three straight quarters. After introducing documented exit criteria (signed mutual action plan, confirmed budget, identified decision date), that same rep's commit accuracy jumped because the bar for "Committed" stopped being a feeling and started being a checklist.
Quick fixes a manager can enforce starting this week:
- Make close date, amount, and lead source mandatory fields with no default values allowed.
- Automatically discount the probability on any deal that's slipped its close date more than once.
- Start a shared variance log visible to the whole team, not just leadership, so reps see their own patterns too.
Pro Tip: If a rep's commit accuracy is consistently off in the same direction, sandbagging or overpromising, don't treat it as a discipline problem first. Ask what incentive in your compensation plan or pipeline review might be rewarding that behavior. Fix the incentive, and the behavior often follows.
Which Tools to Use and How to Choose
Tool choice should follow your team's data maturity, not the other way around. Buying a sophisticated forecasting platform before your CRM data is clean just gives you a more expensive way to produce a wrong number.
Spreadsheets (Microsoft Excel or Google Sheets) remain a legitimate starting point for small teams or anyone still figuring out what their stage definitions should even be. They're flexible, free or nearly free, and force you to understand your own formulas rather than trusting a black box. The tradeoff is manual updating and zero automation, which becomes untenable once you're tracking more than a couple dozen active deals.
CRM-native forecasting, the kind built into platforms like Salesforce or HubSpot, is where most teams land next. Its accuracy ceiling depends heavily on stage definition discipline and data entry quality rather than any feature of the software itself. A CRM's forecasting module is only as good as what your reps actually type into it.
Dedicated forecasting platforms, such as Anaplan for enterprise revenue planning or Salesloft and Outreach for engagement-driven pipeline signals, add layers of behavioral data and automation that a spreadsheet or basic CRM view can't replicate. They require more integration work and cleaner underlying data to pay off, which is why they tend to fit larger teams with established CRM hygiene rather than a five-person startup sales team still figuring out their sales motion.
Before piloting any new tool, check that:
- Your CRM is genuinely the single source of truth, not one of three places reps track deals.
- Activity capture (calls, meetings, follow-ups) happens automatically or with minimal manual friction, since manual logging is often the limiting factor in whether any forecasting model, simple or advanced, actually works.
- API connectors exist between your CRM and whatever forecasting or BI layer you're evaluating.
- You've defined success criteria for the pilot (accuracy improvement, time saved, rep adoption rate) before you start, not after.
A short pilot, 60 to 90 days, against a defined accuracy baseline will tell you more than any vendor demo. Our breakdown of sales tracking tools for cold-call and field reps goes deeper into matching tool categories to team structure.
Why Combining Forecasts Works, Backed by Research
Academic forecasting research has tested this question directly, and the finding holds up: combining forecasts reduces error, often substantially. Studies summarized in a widely cited forecasting principles review found that combining variations within a single method reduced average error by 12.5%, while combining across genuinely different methods reduced errors by as much as 40% in some documented examples. The benefit gets bigger when the combined forecasts come from meaningfully different sources of information, not just two slightly different spreadsheets built on the same assumptions.
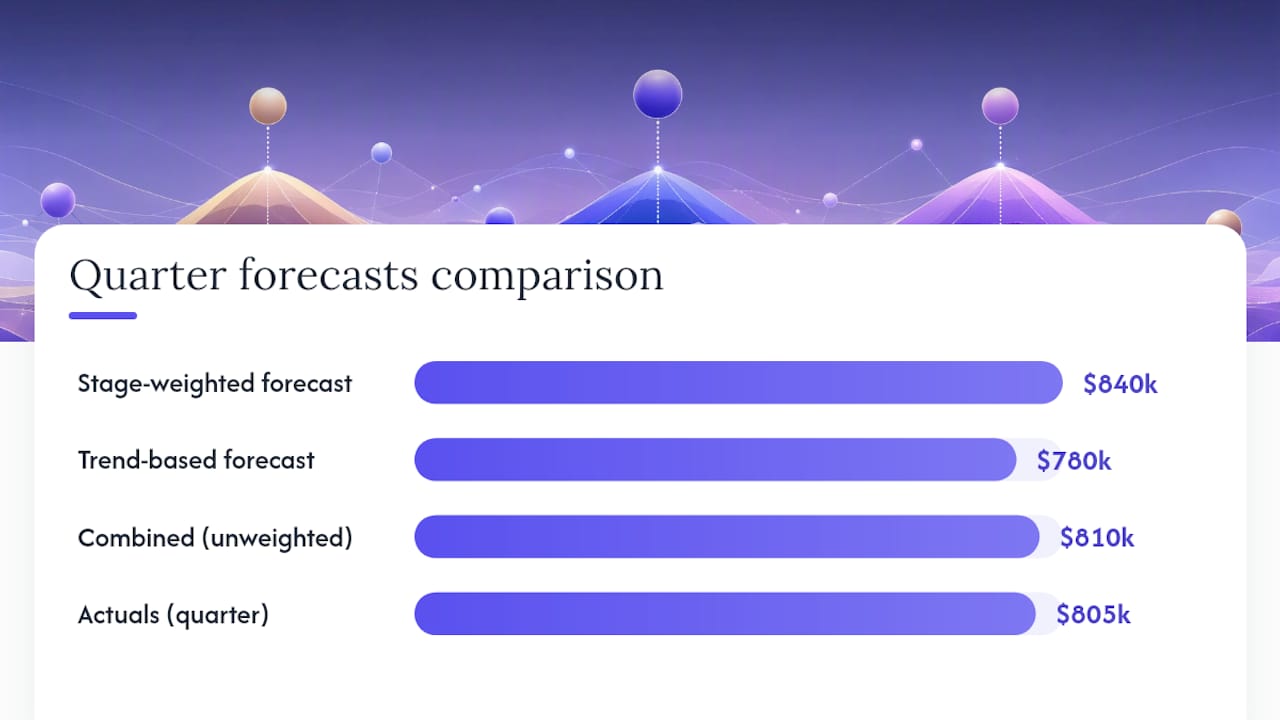
The practical version of this doesn't require a statistics degree. Start with an unweighted average of two diverse forecasts, say, your stage-weighted pipeline number and a simple time-series projection based on historical close patterns. Track how each performs against actuals over a full quarter. If one method consistently beats the other, introduce a modest weight adjustment (proportional to its recent accuracy) rather than switching to it exclusively.
Here's a worked example. Say your stage-weighted forecast for the quarter comes in at $840,000, and a simple trend-based projection using the last four quarters of closed revenue comes in at $780,000. An unweighted average lands at $810,000. If actuals come in at $805,000, the combined number beat either individual method on its own, which is exactly the pattern the research predicts.
- Pick two methods that draw on genuinely different information (rep judgment and historical trend, or stage-weighted pipeline and behavioral scoring).
- Run both in parallel for at least one full quarter without acting on either exclusively.
- Compare each method's error against actuals, then blend them, starting with a simple average before adding weights.
- Revisit the weighting only after 90 days of tracked data, not after a single good or bad month.
Combining adds little value when your two methods share the same underlying bias, like two versions of rep-commit forecasting that both suffer from the same optimism problem, or when your data hygiene is bad enough that both inputs are unreliable in the same direction. Test the benefit before committing to it long-term: if a blended forecast doesn't outperform your best single method over a full quarter, the extra complexity isn't earning its keep.
Pro Tip: If you only have bandwidth to combine two things, combine a model-based number with a human sanity check, not two models. The reason ensembles work is diversity of information, and a manager's judgment about a specific deal is a genuinely different information source than any formula.
A Copyable 30/60/90 Checklist to Start This Quarter
Print this, put it in your team wiki, or copy it into whatever project tool your team already uses. The sequence matters more than the individual tasks.
Days 1 through 30, data hygiene and signals:
- Audit CRM fields for missing close dates, stale stages, and duplicate deals.
- Document stage exit criteria per segment and get manager sign-off.
- Make close date, amount, stage, and lead source mandatory on every opportunity.
- Start logging engagement recency and stakeholder count on active deals.
Days 31 through 60, governance and measurement:
- Launch weekly pipeline reviews with documented outputs.
- Calculate your baseline forecast accuracy rate using the last two closed quarters.
- Start a shared variance log visible to the full team.
- Introduce a second forecasting method (time-series or behavioral scoring) to run in parallel.
Days 61 through 90, refinement:
- Run your first monthly deep dive comparing accuracy across segments and reps.
- Test a simple unweighted combination of your two forecasting methods.
- Hold your first quarterly post-mortem and document what changed.
Track these as your early-win indicators, not the ultimate destination:
- Forecast accuracy rate trending upward month over month, even modestly.
- Variance log showing a shrinking gap between forecasted and actual close amounts.
- Rep-level accuracy becoming more consistent across the team, not just improving on average.
Watch for these warning signs and adjust the plan if you see them:
- Reps quietly reverting to old habits once the initial rollout excitement fades.
- Stage exit criteria being enforced inconsistently between managers.
- A single method's forecast being treated as gospel again instead of checked against the second method.
What Actually Moves the Needle in Real Sales Teams
Most forecast misses I've seen traced back to the same root cause: a stage definition that sounded rigorous in the sales playbook and meant nothing in practice. One team defines "Committed" as a deal with a signed mutual action plan. Another team lets a rep mark a deal "Committed" because the call went well. Both show up in the CRM looking identical, and only one of them is telling the truth.
The fix isn't more sophisticated math. It's forcing a conversation about what evidence actually justifies each stage, and then holding everyone, star reps included, to the same bar. That conversation is uncomfortable the first time, because it usually reveals that your best-performing rep has been getting away with looser stage discipline than everyone else, precisely because their numbers were good enough that nobody questioned the process.
On rep buy-in: frame data logging as protection, not surveillance. A rep who logs every call outcome and follow-up date has a paper trail showing exactly what they did on a deal that later fell through, which matters enormously in a comp dispute or a pipeline review where a manager is questioning their judgment. Reps who see logging purely as a management tool to police them will find ways around it. Reps who see it as their own record of what actually happened tend to keep it current without being asked twice.
How Better Activity Logging Supports Better Forecasts
Every practice in this guide depends on one unglamorous thing: reps actually logging what happened on a call, consistently, the same day it happens. That's the gap most forecasting processes die in, not the math.
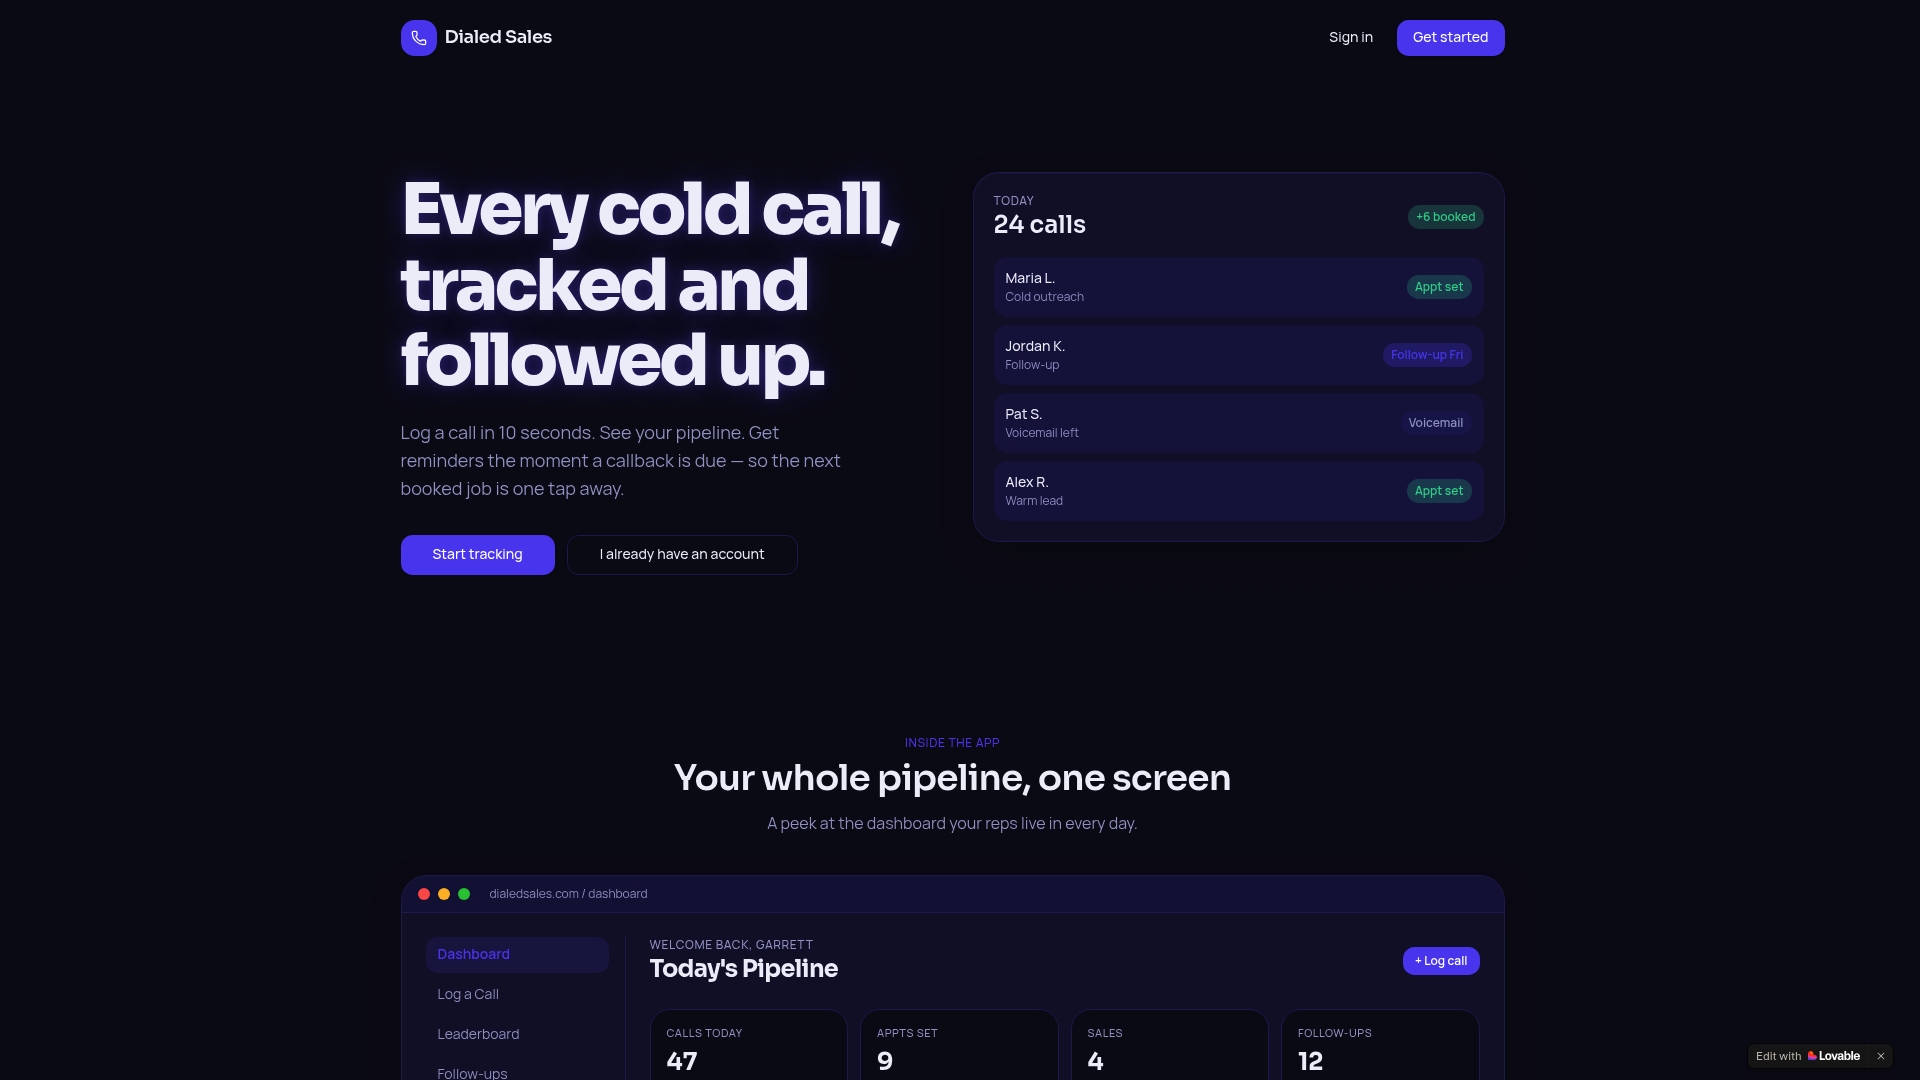
Dialed Sales is built around that exact gap. It's a cold call tracking app for reps and field teams that lets a rep log a call, the customer name, outcome, and notes, in about 10 seconds, then set a follow-up date that automatically surfaces on their dashboard when it's due. That's the behavioral signal layer this whole article has been arguing for: engagement recency, response velocity, and deal momentum, captured at the moment it happens instead of reconstructed from memory during Friday's pipeline review.
The live pipeline dashboard and per-rep activity stats feed directly into the governance cadence covered above. A manager running a weekly pipeline review can see stalled deals and rep-level activity patterns without chasing anyone for an update, and the data going into your stage-weighted or behavioral scoring model gets cleaner because logging takes seconds instead of feeling like paperwork. If you're managing outbound reps in home services, insurance, solar, or any call-heavy sales environment, you can start a free trial and see whether your own forecast accuracy improves once the activity data behind it stops being a guess.
Sources
For readers who want to go deeper into the research and practitioner guidance behind this article, these sources are worth your time.
- Sales Forecasting Best Practices: Revenue Predictions Guide - Fullcast
- Forecasting methods and principles (Armstrong, Green, Graefe) - Wharton faculty paper
- Forecasting methods overview - HubSpot
- Sales forecasting complete guide - ORM
Use these alongside your own variance logs. Research gives you the principle; your own data tells you exactly where your team's forecast tends to drift.